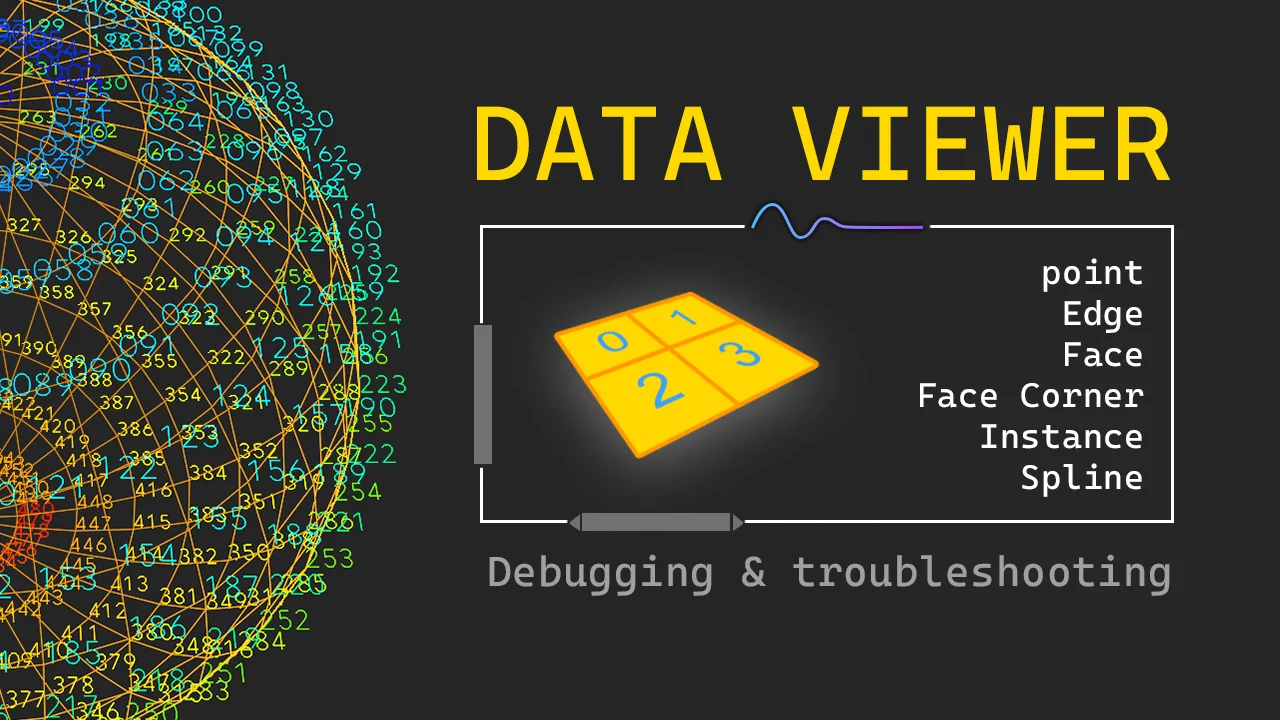
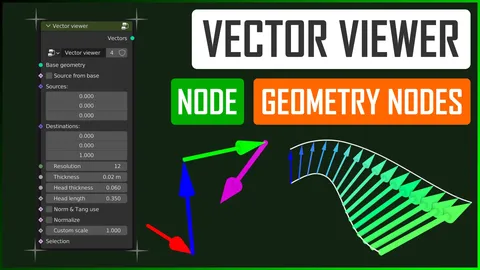
Data Viewer is a Geometry Nodes tool that visualizes attribute data directly within the 3D view, bypassing the need to constantly check the spreadsheet editor. Users can display values like vertex, edge, or face indices, as well as positions, rotations, and radii directly on the corresponding geometry.
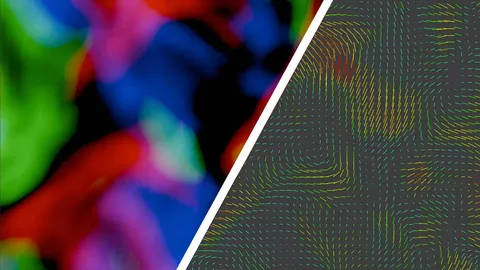
The node group includes parameters to adjust text size, decimal places, flat or vertical orientation, and alignment. It supports gradient coloring to represent value scales, with blue indicating minimums and red indicating maximums. For vector data, it can display axial arrows instead of numbers. An optimization toggle is included for handling large datasets or point clouds more efficiently.
You might also like
5.0 Addon·Free
5.0 Geo Nodes·$2
5.0 Geo Nodes·Free
5.0 Geo Nodes·Free
5.0 Geo Nodes·Free
5.0 Geo Nodes·$2
5.0 Geo Nodes·Free
Geo Nodes·Free

Addon·$3
Geo Nodes·$5.99
5.0 Addon·Free