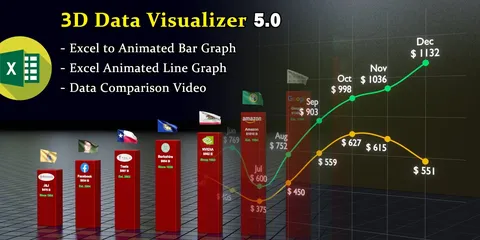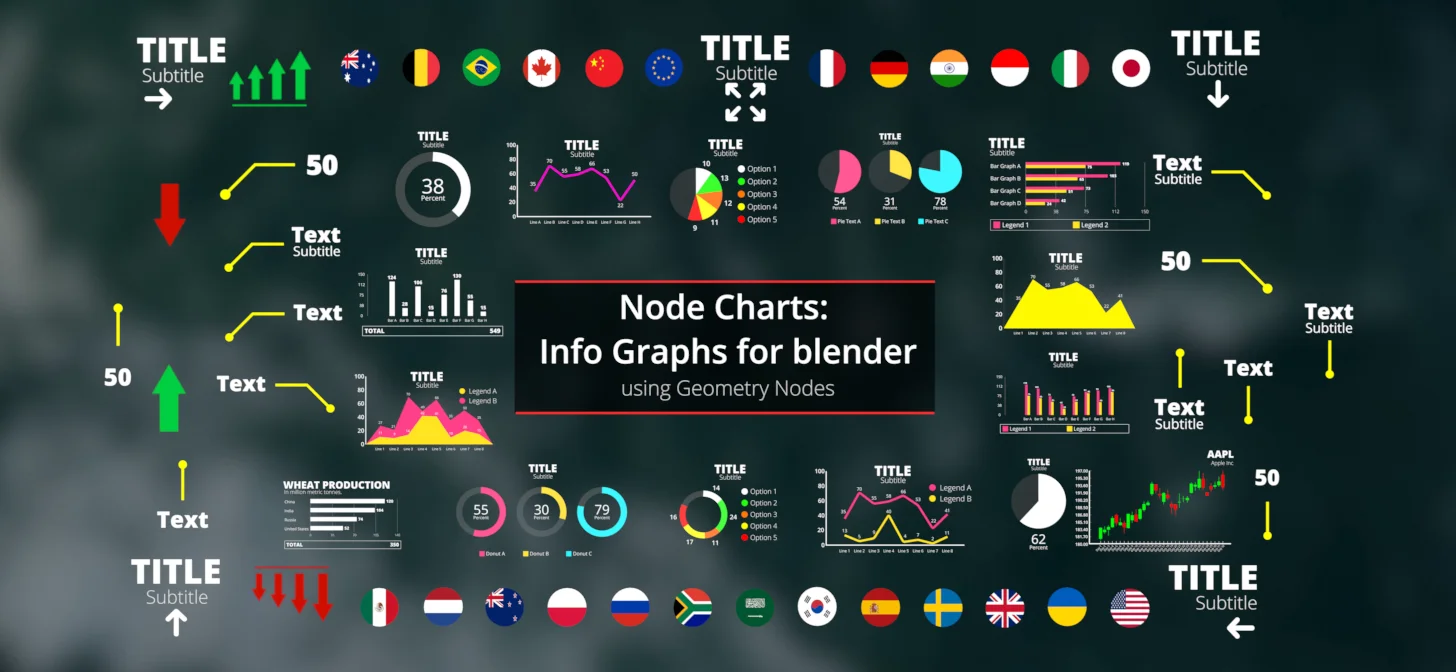
A collection of 25 procedural infographic charts driven by Geometry Nodes, designed to visualize data natively within Blender. The setup supports importing data directly from CSV files and MySQL databases using an included Python add-on tool. The graphs feature dynamic updates and built-in animations with adjustable duration controls, operating without the need for manual keyframing.
The pack provides a diverse range of graph configurations, including bar, line, pie, radar, candlestick, and heatmaps, alongside a dedicated United States data visualization map and five 3D variants optimized for Cycles. Settings for aspect ratios, framerates, brand colors, and bulk font changes are accessible directly from the node modifier interfaces. Formatted for the Asset Browser, the collection is fully compatible with both Cycles and EEVEE render engines and includes supplementary assets like customizable callouts, title animations, and flags.
You might also like